3.6. Signal energy, loudness and decibel#
3.6.1. Signal energy#
By signal energy, we usually mean the variance of the signal, which is the average squared deviation from the mean \( Energy(x)=var(x)=E[(x-\mu)^2], \) where \( \mu=E[x] \) is the average of the signal x. The variance is a measure of energy if we interpret x as the displacement of a pendulum.
Since the amplitude of an oscillating signal varies through the period of the oscillation, it does not usually make sense to estimate the instantaneous energy, but only averaged over some window. Observe however that the windowing function reduces the average energy (it multiplies the signal by a quantity smaller than unity), which introduces a bias that should be corrected if an estimate of the absolute energy is required. Usually, however, the bias is consistent throughout a dataset and can be ignored.
Typical alternative energy estimates:
Energy can be calculated over spectral bands, often called energy bands, that is, a range of frequencies of a time-frequency transform, such as 0 to 1000 Hz, 1000 Hz to 2000 Hz and so one for 1 kHz bands. Observe that the bands should be wide enough that they have a “large” number of frequency components within them such that the variance can be estimated. Such a representation is equivalent with an spectral envelope model of the signal.
In a time-frequency representation, the energy of a single frequency component can be estimated over time. That is, we can take the average energy of a frequency component over several subsequent frames or windows.
Observe that since both of these representations are calculated from windowed signals, they will be similarly biased as the window itself.
3.6.2. Decibel#
A commonly used unit for signal energy is decibel (dB). The formula to convert a signal energy value \( \sigma^2 \) to decibels is
Decibel is thus a logarithmic measure of energy. Trivially, we can convert this formula also to \( 20\,\log_{10}\sigma \) such that it relates signal magnitude (the standard deviation) \( \sigma \) to the decibel scale.
The benefit of using decibels is that signal energies have often a very large range. By taking the logarithm, we obtain a representation where for example visualizations are much easier to handle (see illustration on the right). Moreover, decibels are also closer to human perception of acoustic energy.
3.6.2.1. Energy normalisation, loudness, dBFS and dBov#
In practically all uses of acoustic data, we need to normalize the sounds such that they have approximately the same volume or at least a known volume. For example, consider a television program and advertisements. Most would feel that it is very annoying if the advertisements are much louder than the main program (see also loudness wars). We thus need to normalize the advertisement to match volume of the main program. Normalizing the average energy of the advertisement to match that of the main program is one crude way of doing that. Observe however that perception of energy is different across frequency ranges such that energy and the perceived loudness are not the same thing. To measure loudness we therefore need to model subjective perception. This is an involved subject and not discussed further here. Practical applications however still need some normalization to avoid fundamental problems such as clipping.
The energy measures decibel to overload, dBov and decibel to full-scale, dBFS, are related to the dynamic range of a signal storage or transmission format. Suppose for example that the maximum amplitude that a digital representation in which a signal is represented is \(x_{ov}\). If we would try to represent a larger amplitude than that, then the signal would be clipped (distorted). dBov is a measure of how much below the maximum amplitude (how much below clipping) a signal is. Suppose \(P_{0}\) is the energy of the maximum-amplitude square wave. Then the dBov of a signal with energy \(P\) is defined as
Since the energy of a sinusoid with maximum amplitude is \(\sqrt{\frac12}\) of the maximum-amplitude square wave, then its dBov is \(-3.01\). Observe that dBov values are always negative. dBFS is a similar measure.
In typical cases, input speech signals are normalized to \(-26\) dBov such that moderate processing of the signal is unlikely to cause clipping.
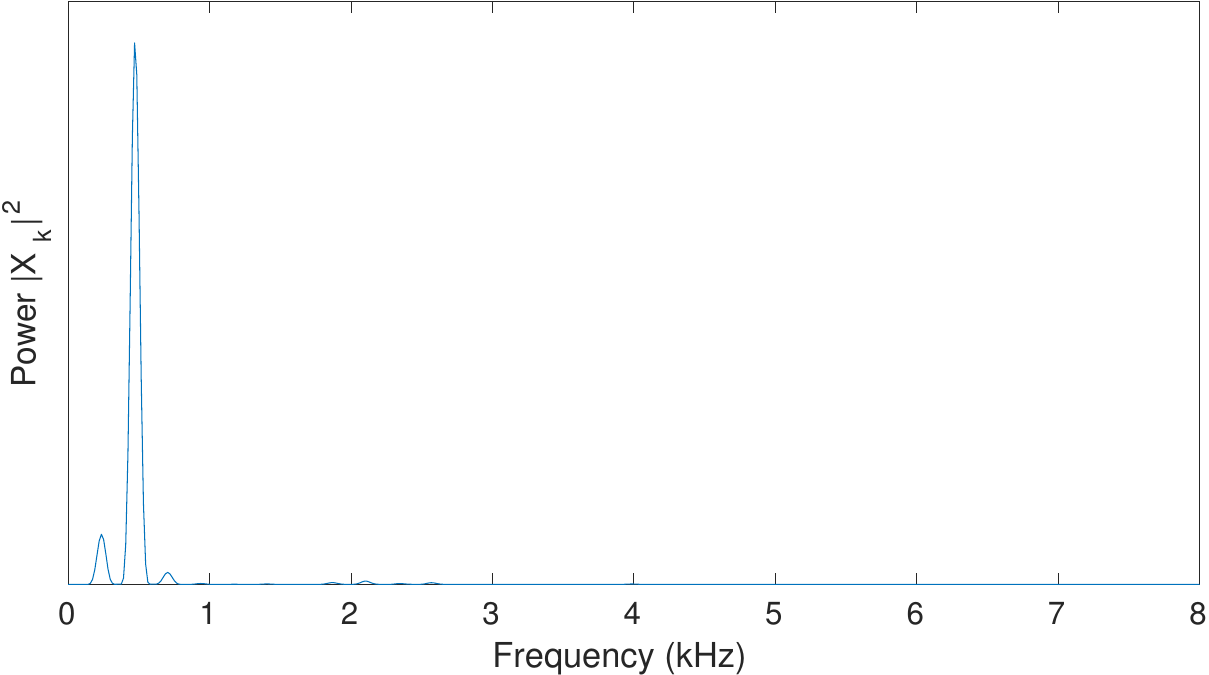
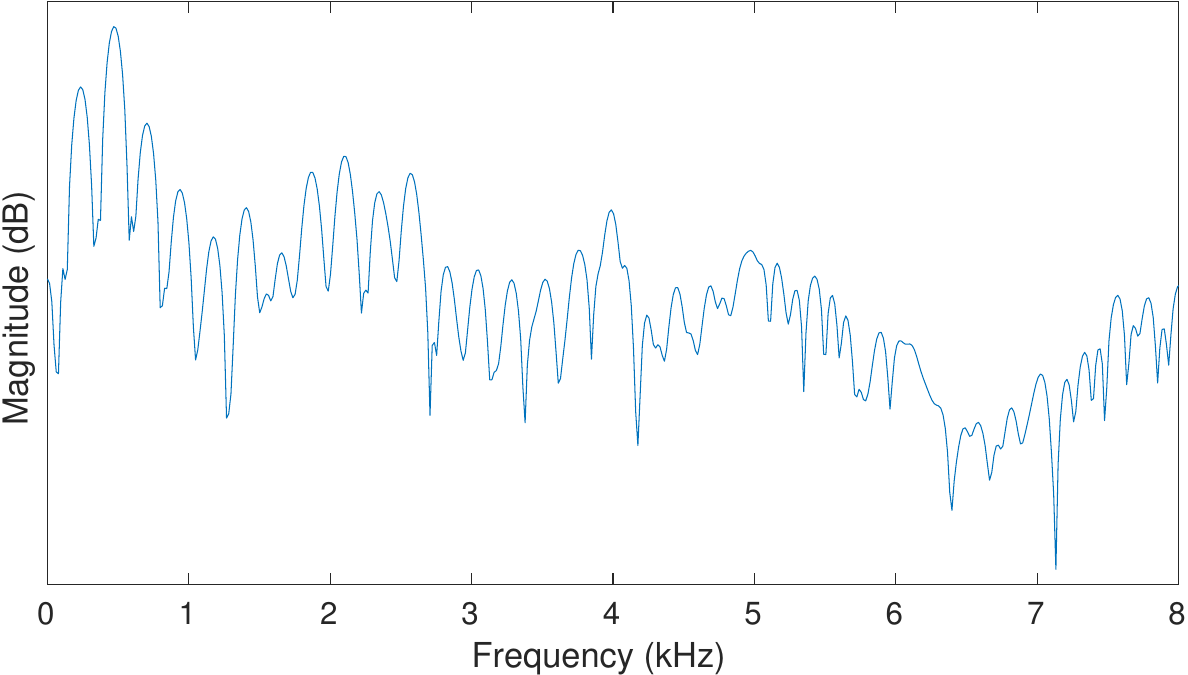
The energy (power) of a speech signal spectrum (above) and its logarithm on the decibel scale (lower).